All data flows including E1a (validated)

Monitor All Data Flows except E2a

Follow the data flows processing (except E2a – UTD data).

Direct link: https://tableau-public.discomap.eea.europa.eu/views/DataMonitor_ng/General

Aggregations and continuity on E1a

Verify the aggregations calculated by the EEA  from the E1a data flow (validated data) and the continuity of the time series over the years.

Direct link: https://tableau-public.discomap.eea.europa.eu/views/Aggregationsandcontinuity/Thesummarydashboard

Aggregations explorer

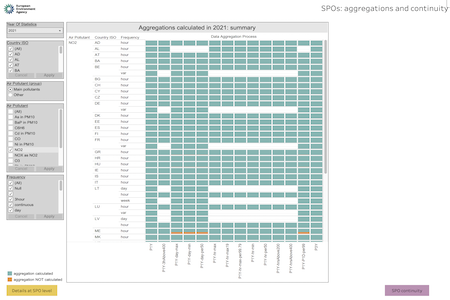
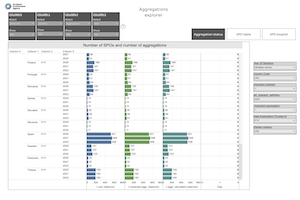
The objective of this tool is to replace the ‘Aggregation and Continuity on E1a’ viewer. This updated version delivers identical information but with enhanced user-friendliness. It allows to verify the aggregations calculated by the EEA  from the E1a data flow (validated data) and the continuity of the time series over the years. Additionally, it offers greater versatility, enabling users to select dimensions for presenting additional features.
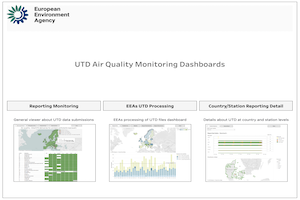
Direct link: https://tableau-public.discomap.eea.europa.eu/views/Aggregationexplorer/Dashboardaggregationstatus/

E2a data flow (UTD data – provisional)

Monitor UTD submission

General viewer about UTD data submissions.

Direct link: https://tableau-public.discomap.eea.europa.eu/views/Airquality_E2a_monitoring/DashboardE2a

Monitor UTD submission

Details about UTD at country and station levels.

Direct link: https://tableau-public.discomap.eea.europa.eu/views/UTD_monitoring_beta_CountryByWeb09032021/SelectCountry

Monitor UTD submission

Details on  UTD data processing.

Direct link: https://tableau-public.discomap.eea.europa.eu/views/UTDprocessing/MeasurementtimelagYearly